Question
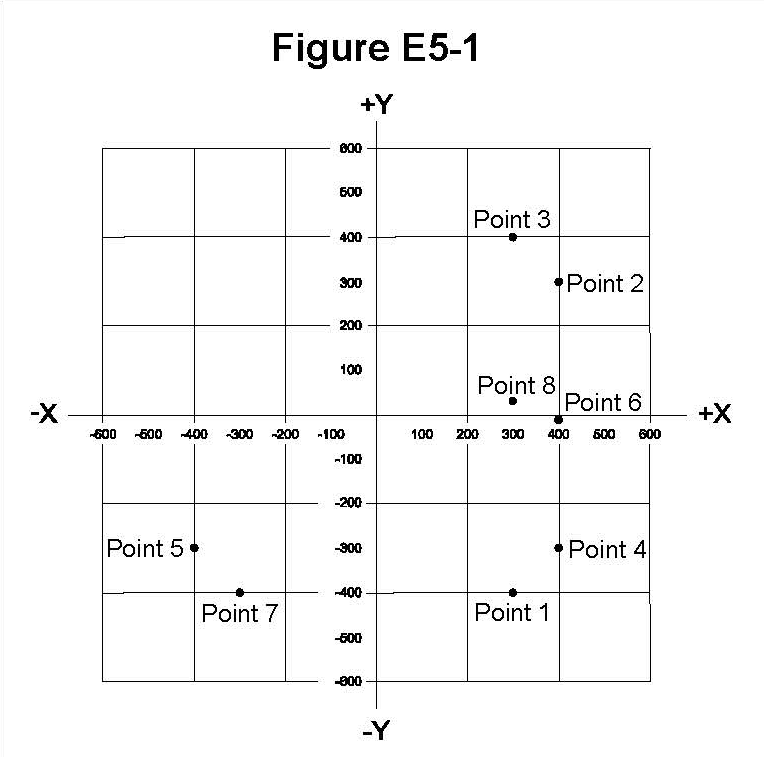
Which point on Figure E5-1 best represents the impedance of a series circuit consisting of a 300-ohm resistor and a 19-picofarad capacitor at 21.200 MHz?
Answer Options
- A) Point 1
- B) Point 3
- C) Point 7
- D) Point 8
Correct Answer: A
Explanation
To determine the impedance, we first calculate the capacitive reactance (X_C) and then express the impedance in rectangular form (Z = R - jX_C). The capacitance is C = 19 \times 10^{-12} \text{ F} and the frequency is f = 21.2 \times 10^6 \text{ Hz}. X_C = \frac{1}{2\pi f C} = \frac{1}{2\pi (21.2 \times 10^6)(19 \times 10^{-12})} \approx 396.5 \Omega The impedance is Z = 300 - j396.5 \Omega. This point must be plotted where R = 300 on the positive X-axis and X is approximately -400 on the negative Y-axis.
Consulting Figure E5-1, the horizontal axis scale is resistive (R), and the vertical axis scale is reactive (X). Point 1 is located at approximately R=+300 and X \approx -400. Therefore, Point 1 best represents the impedance of this capacitive circuit.
This topic was automatically created to facilitate community discussion about this exam question. Feel free to share study tips, memory tricks, or additional explanations!